

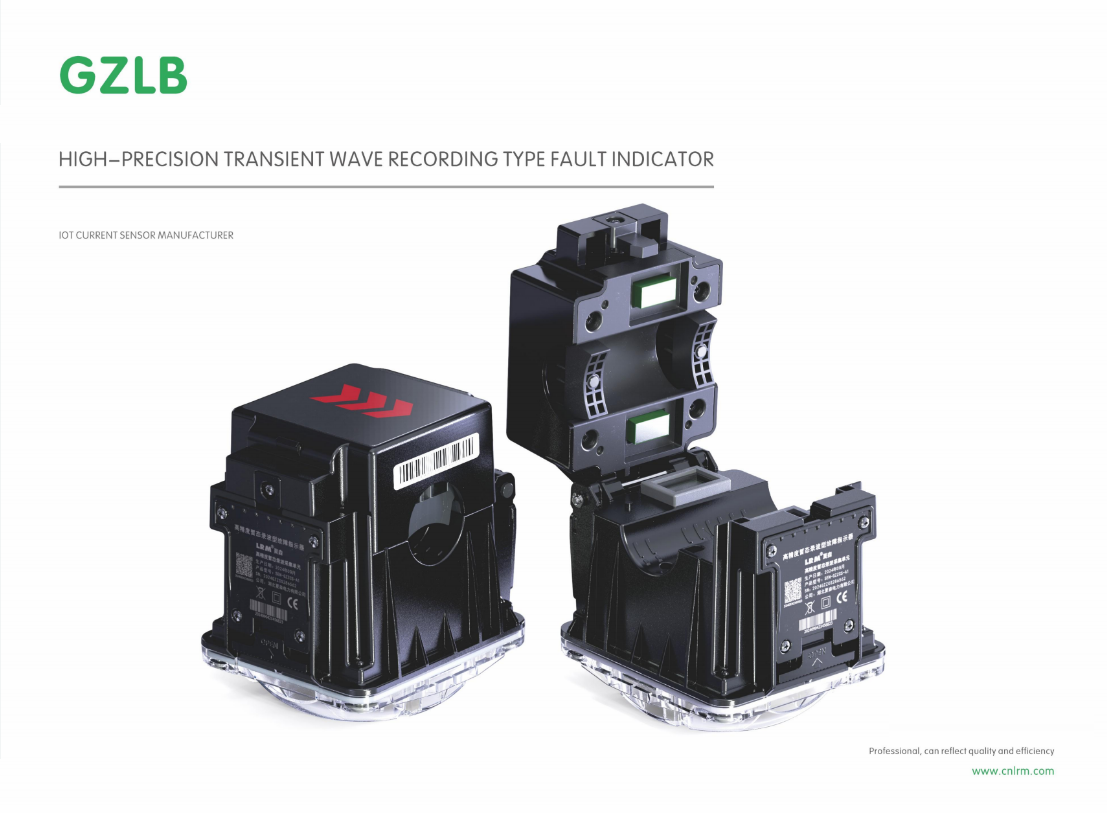
High-Precision Transient Wave Recording Fault Indicators: Top 10 Picks for Grid Reliability
2026-09-20
Grid faults don’t wait for convenient moments—and neither should your monitoring equipment. When milliseconds matter, high-precision transient wave recording fault indicators are the silent sentinels that turn chaos into actionable data. Instead of drowning you in spec sheets, we’ve zeroed in on the top 10 picks that genuinely earn their place on the line. And if you’re tired of false alarms and missed events, Xiasen is one name that keeps coming up for a reason—their approach to precision feels less like marketing and more like engineering you can trust.
Why Transient Wave Recording Changes Fault Indicator Expectations
Traditional fault indicators are built around the assumption that a fault shows up as a clear, sustained change in current magnitude. That works for bolted faults, but it misses a whole class of disturbances that begin with a sharp, short-lived transient. Transient wave recording captures those first microseconds of an event, preserving polarity, rise time, and frequency content that a simple threshold detector throws away. Once that data becomes available, expectations for what a fault indicator should detect expand beyond simply “current exceeded a setpoint” to recognizing arcing signatures, incipient insulation breakdown, or repeated momentary contacts.
The shift also changes how utilities use fault indicators in the field. Instead of just getting a binary flag at a location, operators can examine the recorded waveform to judge direction and approximate distance. A transient reflected from a cable termination, for example, looks different from one originating two spans away. This means a fault indicator is no longer just a yes/no sensor; it becomes a lightweight waveform capture device that supports root-cause analysis after the fact. That raises the bar for sampling rate, memory depth, and triggering logic—requirements that weren’t on the table when fault indicators were simple mechanical flags.
Consequently, specifications written around old expectations—low power draw, minimal data storage, simple contact output—are being revised. Utilities now ask for devices that can trigger on high-frequency signatures, store pre- and post-trigger data, and time-synchronize across multiple units. The ripple effect reaches installation practices too: sensor placement must consider wave propagation and reflections, not just fault current distribution. The net effect is that transient wave recording turns the fault indicator from a passive sentinel into an active diagnostic instrument, and that shift forces everyone involved to rethink what adequate monitoring actually means.
Key Capabilities That Separate Dependable Units from the Rest
Dependable units rarely look remarkable from the outside. They don't rely on heroic last-minute saves or on a star performer who catches every dropped ball. Instead, they operate with a quiet discipline around commit-to-deliver cycles. Each commitment has an owner, each owner works from a written fallback, and each fallback is tested before the team actually needs it. That practice removes the panic that turns a small delay into a full stop.
The second capability is comfort with measured uncertainty. Most groups pad estimates with hope; dependable units derive their timelines from past throughput and known variance. They keep a simple log of what was promised versus what actually shipped, using it to narrow the gap over time. When a deviation does occur, they surface it early, attach two or three recovery options, and let stakeholders choose rather than react. That habit builds a reputation no marketing can buy.
How Waveform Detail Improves Fault Location Accuracy
Fault location accuracy hinges on capturing the transient details that travel along a conductor after a disturbance. A waveform with fine time resolution preserves the sharp leading edges of these traveling waves, allowing the arrival time at a monitoring point to be pinned down to a fraction of a microsecond. Without that level of detail, the reflected pulses can blur together with the main surge, making it impossible to separate the initial fault signature from later echoes caused by impedance discontinuities.
Beyond timing, waveform detail reveals subtle variations in amplitude and polarity that indicate whether a fault is permanent or temporary, grounded or phase-to-phase. Small kinks and secondary reflections—often lost in low-resolution recordings—serve as fingerprints for specific network topologies. By matching these measured waveform features against known propagation behavior, technicians can narrow the search area to a single span or tower instead of patrolling several miles of line.
In practical terms, higher sampling rates and wider bandwidths turn ambiguous disturbances into distinct, classifiable events. A fault that would otherwise appear as a generic overcurrent now shows identifiable wavefront characteristics, such as a steep initial slope followed by a damped oscillation unique to a cable joint failure. This granularity reduces trial-and-error and speeds up restoration because field crews receive coordinates based on measured waveform evidence rather than rough impedance estimates.
Installation Considerations for Overhead and Underground Grids
Choosing between overhead and underground grid installations starts with a close look at the terrain, existing infrastructure, and long-term maintenance capacity. Overhead lines demand wider corridors and careful clearance from trees, buildings, and road crossings, while underground systems require trenching that can disturb soil, pavement, and nearby utilities. Local permitting often hinges on environmental impact assessments, especially in wetlands or densely built areas where excavation risks are higher.
Overhead grids benefit from lower upfront material costs and faster fault detection, but they face ongoing vegetation management and weather-related vulnerabilities like ice loading or high winds. Pole placement must account for soil stability and access for bucket trucks, and conductor sag under thermal expansion needs precise tension calculations. Underground installations, by contrast, eliminate visual clutter and reduce storm outage frequency, yet they demand rigorous waterproofing, proper bedding sand, and warning tape to prevent third-party dig-ins. Cable duct banks should include spare conduits to avoid costly future excavation.
Thermal performance differs sharply between the two approaches. Buried cables rely on soil thermal resistivity for heat dissipation, so backfill material and spacing between circuits directly affect ampacity. Overhead conductors cool naturally in open air but require dynamic line rating systems in hot climates to avoid annealing. For either method, installers should coordinate with telecom, gas, and water utilities early, use ground-penetrating radar before digging, and document as-built locations with GPS accuracy to streamline future repairs.
Choosing Indicators That Handle High-Frequency Transients Cleanly
High-frequency transients are those fleeting, sharp price spikes or dips that often evaporate before slower indicators even register the move. Choosing an indicator that handles them cleanly means looking past raw responsiveness, because many popular oscillators overreact to these blips and spit out false divergences or premature reversals. A better choice is one that smooths the transient without adding so much lag that the actual trend gets buried.
Indicators with built-in volatility normalization, like those using average true range or a median filter instead of a simple moving average, tend to absorb transient noise more effectively. Asymmetry also helps: some indicators deliberately ignore upside spikes that are liquidity-driven while still tracking sustained price shifts. Testing on tick data or one-minute charts across different sessions—pre-market, regular hours, after hours—quickly shows which ones produce fewer whipsaws.
Rather than chasing the newest low-lag formula, pair a fast trigger with a slower confirmation that only validates after the transient window has closed. The Chande Momentum Oscillator or a median-filtered RSI often handles high-frequency noise better than their textbook versions. Ultimately, the best indicator is the one that trims false signals without slicing off genuine trend turns.
Matching Device Strengths to Your Grid's Most Common Fault Patterns
Grid faults rarely read the manual. On a rural feeder with long laterals and frequent lightning strikes, the dominant issue is often transient faults that clear themselves in a few cycles. In an underground urban network, however, you're more likely dealing with permanent cable faults and high-resistance ground faults that demand a different sensitivity profile. Matching a protective device's strengths to these patterns starts with pulling actual fault records, not relying on generic assumptions. Look at the ratio of momentary to permanent faults, the typical fault current magnitudes, and whether faults cluster during specific weather or load conditions. Only then does a device's feature set become meaningful rather than just a checklist item.
Once the fault signature is clear, the selection logic falls into place. For transient-heavy overhead lines, a recloser with aggressive fast-curve timing and high interrupting capacity prevents nuisance lockouts while preserving coordination. For areas with stubborn high-impedance faults, a device with sensitive earth-fault detection and directional elements earns its keep far better than one with raw speed. The key is to map each device capability—whether it's inrush restraint, cold-load pickup handling, or communication-assisted tripping—directly to a fault pattern you've actually observed. A common mistake is over-buying features that address rare events while ignoring the daily nuisance trips that erode reliability metrics.
Field experience consistently shows that a modest device well matched to the local fault profile outperforms a feature-rich unit deployed on guesswork. For example, a utility with recurring fuse-saving misoperations found that switching to a recloser with adaptive timing based on fault current direction eliminated most of the unnecessary outages without any new hardware. Another operator reduced sustained interruptions by 18% simply by adjusting pickup thresholds after analyzing three years of fault data—no new equipment needed. The principle is straightforward: let the fault patterns dictate the device strengths you require, not the other way around. That shift in thinking is what separates a reliable grid from one that merely looks modern on paper.
FAQ
Conventional fault indicators usually just flip a flag or blink an LED when a fault passes through. High-precision transient wave recording fault indicators capture the actual voltage and current waveforms before, during, and after a fault at high sampling rates. This lets engineers see the transient signature, not just that something tripped. It is the difference between knowing a breaker opened and understanding exactly why it opened.
Transient wave recording preserves the fast electrical events that occur in the first few milliseconds of a fault. Those waveforms reveal whether a fault is a tree branch contact, an insulator flashover, or a cable insulation breakdown. With that detail, crews can be dispatched to the most likely location instead of patrolling miles of line. Less guesswork means shorter outages and fewer repeated faults.
Look beyond the sales sheet. The most important traits are trigger sensitivity at high sampling rates, pre-trigger buffer depth, and how well the device rejects false triggers from capacitor switching or inrush currents. Also check whether the waveform files are easy to pull remotely and integrate with existing fault analysis software. A device that records great data but makes you climb a pole to retrieve it is not much help.
Yes, especially in cable systems where visual inspection is impossible. By capturing the high-frequency traveling wave arrival times or by comparing waveform polarity and amplitude across multiple sensors, utilities can narrow the fault down to a specific cable section or joint. This is far more efficient than the old method of sectionalizing and re-energizing until the fault reappears.
Intermittent faults, like a failing splice that only arcs under heavy load, are a nightmare for standard indicators because the event is over in cycles. High-precision recorders use pre-trigger and long post-trigger windows plus repeated event capture. They store multiple waveform snapshots over weeks or months, allowing engineers to spot a pattern that points to a degrading component before it becomes a permanent outage.
They act as distributed waveform sensors along feeders and laterals. Many models can sync their clocks via GPS or network time and stream waveform data to SCADA, ADMS, or centralized fault analytics platforms. This turns a simple indicator into a grid-edge monitoring node that supports real-time situational awareness and predictive maintenance.
Space on overhead lines or inside pad-mounted gear is often tight, and the sensor must be mounted correctly to get accurate phase measurements. Some devices draw power from the line current, which means they go to sleep under light load unless they have a battery backup. Wireless communication can also be tricky in vaults or remote areas, so plan for antenna placement and signal testing before committing.
Expect onboard edge computing that classifies fault types locally and only sends alerts for unusual events. Sampling rates will keep climbing, and low-power wide-area networking will make it practical to deploy dozens of sensors per feeder. Integration with digital twin models of the distribution grid is another likely step, where recorded waveforms automatically update the simulated network state and suggest the next inspection point.
Conclusion
Modern grid operators have learned that a fault indicator is only as useful as the waveform it captures. Transient wave recording shifts expectations because it preserves the high-frequency signatures that simple magnitude or duration readings miss, turning a vague alarm into a diagnostic record. The best options now separate themselves by how cleanly they handle those fast transients, with front-end filters and sampling rates that avoid clipping or aliasing. That detail matters most when a tree branch grazes an overhead conductor or an underground splice begins to break down: the first few microseconds often reveal whether the event is a permanent fault, a momentary disturbance, or a precursor worth watching. Installers also need to weigh physical constraints, since overhead pole-mounting and pad-mounted underground applications demand different CT windows, shielding, and power harvesting approaches.
Equipment worth shortlisting for grid reliability usually gets a few things right without overengineering the package. It samples fast enough to reconstruct the actual transient shape, stores enough pre-trigger and post-trigger data to show what happened before and after the first overcurrent, and presents that information without forcing a crew to wade through clutter. More importantly, the chosen indicator has to match the failure patterns your network actually sees: long rural feeders with single-phase taps benefit from directional sensing and time-stamped event correlation, while dense urban underground loops rely more on zero-sequence detection and communication backhaul. When waveform detail aligns with those local fault signatures, crews spend less time patrolling and more time restoring service. That is the quiet value of high-precision transient recording—not just finding the fault, but understanding it well enough to prevent the next one.
Contact Us
Contact Person: Liu Mengyang
Email: [email protected]
Tel/WhatsApp: 8618727589233
Website: https://www.cnlrm.com/en/